Building a Raspberry Pi Homelab Rack Dashboard
Turning an unused monitor and Raspberry Pi into a dedicated kiosk display for real-time homelab information.
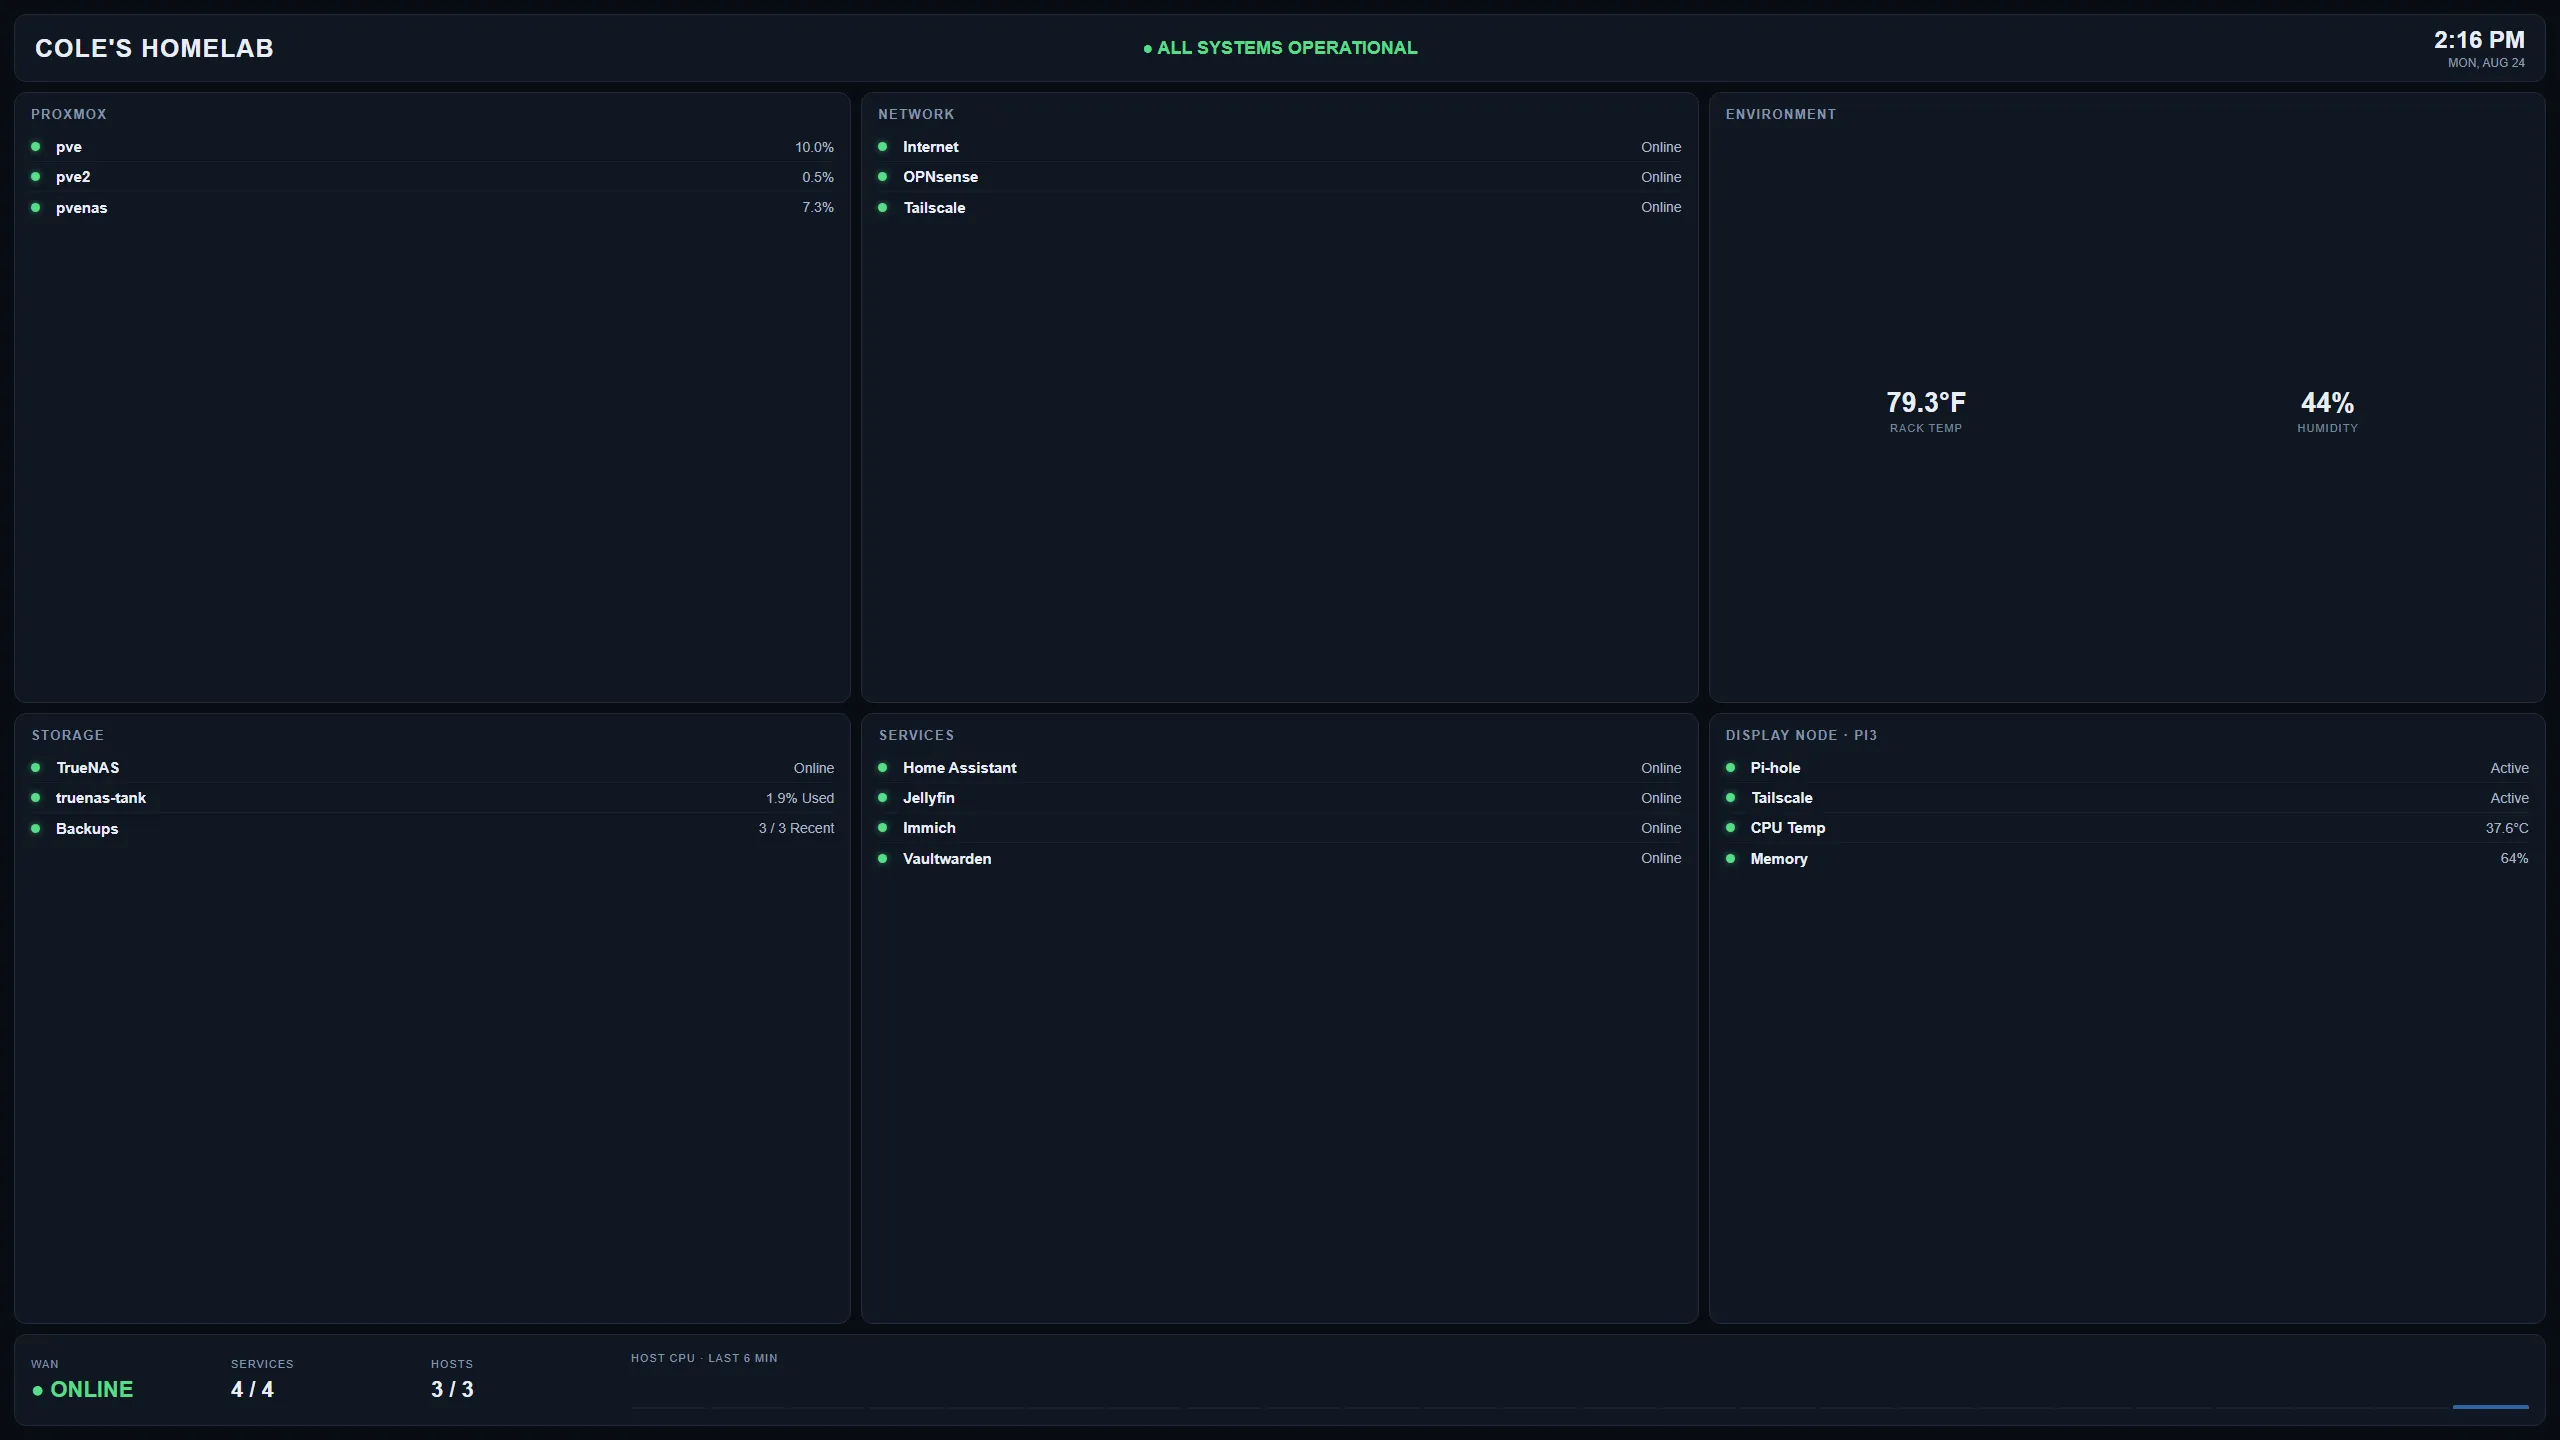
Overview
I wanted a dedicated display near my server rack that could provide useful homelab information at a glance without requiring me to open a dashboard on another computer.
Rather than purchasing dedicated monitoring hardware, I decided to reuse an existing monitor and a Raspberry Pi.
Goals
The project had several requirements:
- Automatically boot into the dashboard
- Require no keyboard or mouse during normal operation
- Run a lightweight Linux environment
- Launch the dashboard in full-screen kiosk mode
- Remain useful as an always-on infrastructure display
- Avoid using my main homelab homepage as the rack interface
Architecture
The final design uses a Raspberry Pi running Debian with a minimal graphical environment.
The display stack consists of:
- Debian Linux
- Xorg
- Openbox
- Chromium
- Unclutter
- A dedicated web-based rack dashboard
Chromium launches automatically in kiosk mode and displays a page designed specifically for the rack monitor.
Display Configuration
One challenge was matching the operating system and Chromium environment to the monitor’s native behavior.
After testing multiple configurations, I settled on a 1360 × 768 kiosk resolution.
This provided a better fit for the display and allowed the dashboard to remain readable from a distance.
Power and Usability
Because the monitor is intended to remain available near the rack, I also considered nighttime brightness and overall power usage.
The display can run at a low brightness level when necessary without affecting the servers or monitoring services themselves.
What I Learned
This project combined several small Linux concepts into one practical system:
- automatic graphical startup
- display configuration
- kiosk-mode browsers
- lightweight window managers
- service troubleshooting
- web dashboard design
None of those components are particularly complicated individually, but integrating them into a reliable appliance-style system was the useful part of the project.
Future Improvements
Future additions may include:
- automatic display sleep and wake schedules
- additional infrastructure metrics
- alert indicators
- UPS status
- network health information
- improved responsive dashboard layouts